About
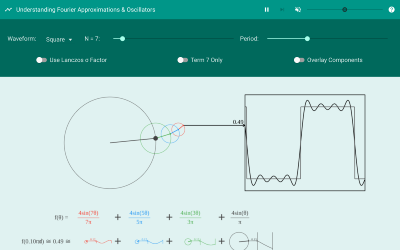
An HTML5 canvas visualization of how Fourier series, or adding smaller and faster sin waves together, can approximate any periodic wave that you can then hear directly. These visualizations provide the foundation for oscillators used in most music synthesizers. The visualization shows each sin wave as a circle being added to the previous sin wave’s value. It color codes them so that the equation, component, and circle can be easily recognized. By using the WebAudio API, these waves can be heard individually or all together by directly using the math shown. Since we can’t hear sound waves of 1-2Hz, the audio frequency is instead based at 220Hz, but the actual sound wave is still exactly what is shown (save for normalization of the > 1 values).
Technologies
- HTML/CSS/JS
- AngularJS
- Google Material Design Components
- WebAudio oscillators
- HTML5 canvas 2d
Features
- View how computers approximate analog waves as a digital signal
- Provides an intuition for connecting math, visual representations, and auditory cues to convey the underlying principles.
Project Details
Date: Feb 1, 2016
Client: Side project